|
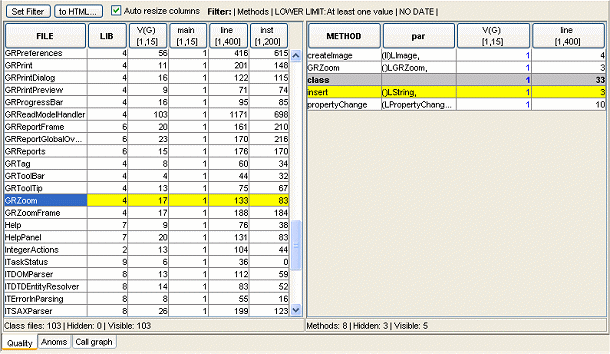
The analyse process computes a set of software quality measures for each analysed source file.
The quality values can be examined in the Quality tab of the Analyse results pane.

The example above shows the following quality values measured:
- Cyclomatic complexity V(G).
- The cyclomatic complexity of the main routine if the file.
- Number of lines.
- Number of lines with valid commands.
The quality values are available at both the File (left part) and Method (right part) level.
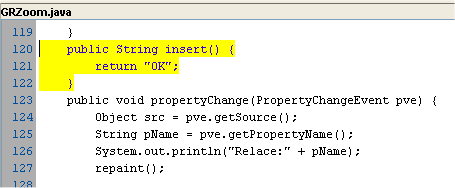
The Source pane sychronizes with the selected method to show and examine the code directly.

The presentation of analysed quality values can be modified using a comprehensive Quality Table Filter.
The filter allows to select which quality values are shown and is able to filter out values, which are above or below defined limits.

|